
Stephanie Armour and Barbara Hansen
USA Today
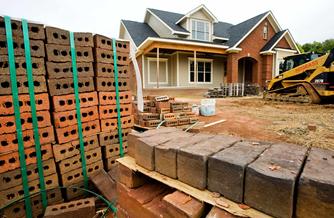
By Gary Crosby Jr., AP
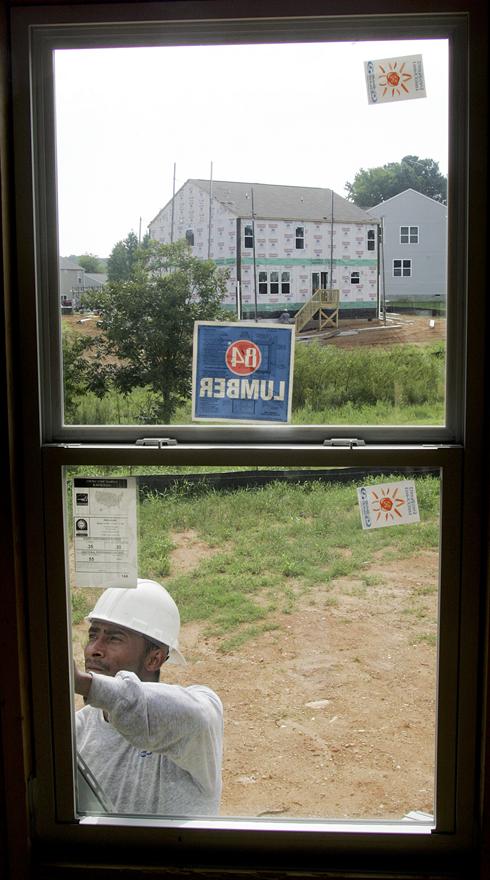
The number of U.S. homeowners is down about 142,000
More Americans found housing unaffordable last year, even though home prices across the U.S. have taken a major fall. More than 40 million spent 30% or more of their household income on housing costs, 600,000 more than in 2007, according to 2008 Census data released Monday. That includes homeowners with and without mortgages, as well as renters.
The number of renters increased, while the number of homeowners declined.
A bright spot: The share of homeowners with mortgages spending nearly a third of their income on housing held stable in 2008, after steady increases since 2002.
Nearly two in five homeowners with mortgages and half of renters paid 30% or more of their before-tax income on housing costs, which is the limit the government sets for determining that housing is unaffordable, according to an analysis of Census data done for USA TODAY by the Joint Center for Housing Studies at Harvard University.
Housing costs for homeowners include mortgage payments, taxes, insurance and utilities. Renter costs include rent and utilities, if they are paid separately.
The prices of homes this year are down more than 20% compared with the peak of the housing bubble in 2006, according to the National Association of Realtors.
“Although housing affordability for newly purchased homes has improved, overall affordability for renters or owners is unchanged or worse because of the economy,” says Daniel McCue, research analyst at Harvard’s Joint Center for Housing Studies. “People are still hurting.”
Fewer homeowners
Reflecting the rapid pace of foreclosures, the number of homeowners dropped by about 142,000.
From 2007 to 2008 the homeownership rate fell more than half a percentage point, to 66.6% — the lowest level since 2002, says Mark Mather, a vice president at the Population Reference Bureau in Washington, D.C.
Many of those former homeowners have become renters, a segment feeling the brunt of steep housing costs. About half of renters spend at least 30% of their before-tax pay for housing.
Overall, the number of renters swelled by nearly 900,000 in 2008 compared with 2007. In the same time, renters stretching financially to make their rent rose by 601,000.
“The fact that affordability for renters is getting worse shows the impact of the economic downturn,” McCue says.
Renters are also more likely to be severely financially burdened. One in four paid half or more of their incomes for housing last year.
“The average monthly rent for a Manhattan apartment is still very high for most people,” says Matthew Baron, who co-owns a $300 million portfolio of multifamily and other buildings in the New York area. “We are also seeing a lot of people double or triple up with roommates in order to split the high rental costs.”
The new Census data show affordability remains difficult in many states, even in those hard hit by foreclosures and falling home values. Median housing costs for owners with mortgages, after adjusting for inflation, increased in 2008 from 2007 for nine states and decreased for eight states.
That’s partly because existing homeowners aren’t receiving the benefits of cheaper housing. They are often stuck in their properties, owing more than their homes are worth but unable to find a buyer.
Miami stretch
Among the top 100 metro areas, most of the top 10 least affordable ones for mortgage owners were in California and the rest were in Florida.
As in 2007, Miami-Fort Lauderdale remained one of the largest metro areas where a high percentage of homeowners spent at least 30% of their income on housing.
“Our home prices are already higher than most areas,” says Mike Premny, a broker and owner of Icon Capital Group in San Francisco. “People here understand our housing market is unique and (will pay more).”
He says banks may approve loans where borrowers put a greater amount of their income for a mortgage if they have solid credit and make large down payments.
David Kerr, a Realtor with Zip Realty in the San Francisco area, says buyers are willing to stretch because they believe their home equity will grow over time. First-time buyers especially are willing to spend a higher proportion of their incomes to become owners.
“To be able to have a house they want, it’s worth having peanut butter sandwiches for a year,” Kerr says.
|
HOUSING AFFORDABILITY ACROSS THE USA |
|
Metro |
Renters spending 30% or more |
Homeowners with mortgages spending 30% or more |
Renters spending 50% or more |
Homeowners with mortgages spending 50% or more |
|
|
||||
|
Akron, OH |
47.1% |
32.7% |
24.8% |
11.6% |
|
|
||||
|
Albany-Schenectady-Troy, NY |
43.7% |
31.8% |
23.4% |
10.5% |
|
|
||||
|
Albuquerque, NM |
50.5% |
36.9% |
27.2% |
14.2% |
|
|
||||
|
Allentown-Bethlehem-Easton, PA-NJ |
46.8% |
38.8% |
23.1% |
13.3% |
|
|
||||
|
Atlanta-Sandy Springs-Marietta, GA |
49.6% |
35.6% |
24.1% |
13.4% |
|
|
||||
|
Augusta-Richmond County, GA-SC |
50.4% |
30.7% |
27.1% |
12.5% |
|
|
||||
|
Austin-Round Rock, TX |
49.4% |
31.9% |
23.9% |
11.2% |
|
|
||||
|
Bakersfield, CA |
57.3% |
46.0% |
29.8% |
20.6% |
|
|
||||
|
Baltimore-Towson, MD |
49.9% |
36.7% |
23.5% |
13.4% |
|
|
||||
|
Baton Rouge, LA |
53.5% |
26.0% |
29.2% |
10.3% |
|
|
||||
|
Birmingham-Hoover, AL |
46.9% |
29.6% |
23.3% |
10.4% |
|
|
||||
|
Boise City-Nampa, ID |
43.3% |
33.4% |
16.8% |
12.6% |
|
|
||||
|
Boston-Cambridge-Quincy, MA-NH |
49.3% |
42.8% |
25.1% |
16.9% |
|
|
||||
|
Bradenton-Sarasota-Venice, FL |
57.3% |
51.2% |
29.3% |
25.1% |
|
|
||||
|
Bridgeport-Stamford-Norwalk, CT |
52.8% |
43.8% |
26.9% |
18.8% |
|
|
||||
|
Buffalo-Niagara Falls, NY |
50.6% |
29.1% |
29.3% |
9.6% |
|
|
||||
|
Cape Coral-Fort Myers, FL |
54.4% |
56.1% |
25.9% |
25.9% |
|
|
||||
|
Charleston-North Charleston-Summerville, SC |
52.7% |
37.1% |
26.5% |
13.6% |
|
|
||||
|
Charlotte-Gastonia-Concord, NC-SC |
43.0% |
30.5% |
21.5% |
10.4% |
|
|
||||
|
Chattanooga, TN-GA |
50.3% |
31.5% |
23.7% |
10.5% |
|
|
||||
|
Chicago-Naperville-Joliet, IL-IN-WI |
50.2% |
43.8% |
27.0% |
17.8% |
|
|
||||
|
Cincinnati-Middletown, OH-KY-IN |
46.8% |
30.0% |
23.4% |
10.6% |
|
|
||||
|
Cleveland-Elyria-Mentor, OH |
51.1% |
34.2% |
28.0% |
12.4% |
|
|
||||
|
Colorado Springs, CO |
45.7% |
34.4% |
21.2% |
12.4% |
|
|
||||
|
Columbia, SC |
49.1% |
26.7% |
24.7% |
9.9% |
|
|
||||
|
Columbus, OH |
46.1% |
30.3% |
22.2% |
9.5% |
|
|
||||
|
Dallas-Fort Worth-Arlington, TX |
48.0% |
32.4% |
22.2% |
11.5% |
|
|
||||
|
Dayton, OH |
48.8% |
28.7% |
24.9% |
9.5% |
|
|
||||
|
Denver-Aurora, CO /1 |
50.9% |
37.7% |
25.1% |
13.8% |
|
|
||||
|
Des Moines-West Des Moines, IA |
44.5% |
26.1% |
24.1% |
7.5% |
|
|
||||
|
Detroit-Warren-Livonia, MI |
52.8% |
38.3% |
28.6% |
15.1% |
|
|
||||
|
El Paso, TX |
52.0% |
34.6% |
26.9% |
13.2% |
|
|
||||
|
Fresno, CA |
57.2% |
49.4% |
31.0% |
20.7% |
|
|
||||
|
Grand Rapids-Wyoming, MI |
51.0% |
33.4% |
26.7% |
11.8% |
|
|
||||
|
Greensboro-High Point, NC |
46.1% |
32.8% |
22.0% |
12.1% |
|
|
||||
|
Greenville-Mauldin-Easley, SC |
46.0% |
27.2% |
22.8% |
11.6% |
|
|
||||
|
Harrisburg-Carlisle, PA |
41.1% |
27.9% |
21.3% |
9.2% |
|
|
||||
|
Hartford-West Hartford-East Hartford, CT |
50.1% |
36.5% |
27.0% |
12.5% |
|
|
||||
|
Honolulu, HI |
56.2% |
47.4% |
29.1% |
19.0% |
|
|
||||
|
Houston-Sugar Land-Baytown, TX |
45.9% |
32.2% |
20.9% |
12.2% |
|
|
||||
|
Indianapolis-Carmel, IN |
47.8% |
28.0% |
22.3% |
8.8% |
|
|
||||
|
Jackson, MS |
54.3% |
28.0% |
30.3% |
10.9% |
|
|
||||
|
Jacksonville, FL |
50.2% |
39.4% |
22.3% |
13.9% |
|
|
||||
|
Kansas City, MO-KS |
42.9% |
28.2% |
20.4% |
9.3% |
|
|
||||
|
Knoxville, TN |
45.2% |
28.9% |
24.2% |
10.0% |
|
|
||||
|
Lakeland-Winter Haven, FL |
51.5% |
42.7% |
25.2% |
18.2% |
|
|
||||
|
Las Vegas-Paradise, NV |
50.2% |
50.9% |
23.0% |
21.6% |
|
|
||||
|
Little Rock-North Little Rock-Conway, AR |
50.6% |
26.3% |
26.8% |
8.0% |
|
|
||||
|
Los Angeles-Long Beach-Santa Ana, CA |
56.4% |
55.0% |
29.1% |
26.3% |
|
|
||||
|
Louisville/Jefferson County, KY-IN |
45.6% |
29.0% |
23.6% |
10.5% |
|
|
||||
|
Madison, WI |
46.7% |
34.2% |
22.8% |
9.4% |
|
|
||||
|
McAllen-Edinburg-Mission, TX |
54.7% |
43.2% |
31.6% |
18.6% |
|
|
||||
|
Memphis, TN-MS-AR |
53.7% |
34.7% |
29.1% |
14.0% |
|
|
||||
|
Miami-Fort Lauderdale-Pompano Beach, FL |
62.6% |
57.2% |
33.7% |
28.8% |
|
|
||||
|
Milwaukee-Waukesha-West Allis, WI |
48.3% |
35.5% |
24.7% |
12.1% |
|
|
||||
|
Minneapolis-St. Paul-Bloomington, MN-WI |
50.6% |
35.7% |
23.5% |
11.8% |
|
|
||||
|
Modesto, CA |
58.1% |
55.7% |
31.7% |
25.3% |
|
|
||||
|
Nashville-Davidson–Murfreesboro–Franklin, TN |
47.2% |
31.1% |
22.0% |
10.0% |
|
|
||||
|
New Haven-Milford, CT |
54.8% |
44.0% |
28.8% |
16.0% |
|
|
||||
|
New Orleans-Metairie-Kenner, LA |
58.1% |
35.6% |
31.3% |
15.3% |
|
|
||||
|
New York-N. New Jersey-Long Island, NY-NJ-PA |
50.6% |
48.9% |
26.8% |
22.1% |
|
|
||||
|
Ogden-Clearfield, UT |
39.3% |
35.6% |
17.6% |
9.5% |
|
|
||||
|
Oklahoma City, OK |
46.2% |
26.2% |
23.7% |
8.8% |
|
|
||||
|
Omaha-Council Bluffs, NE-IA |
45.6% |
28.1% |
22.0% |
7.8% |
|
|
||||
|
Orlando-Kissimmee, FL |
57.2% |
49.5% |
29.5% |
21.5% |
|
|
||||
|
Oxnard-Thousand Oaks-Ventura, CA |
54.9% |
53.9% |
24.2% |
22.9% |
|
|
||||
|
Palm Bay-Melbourne-Titusville, FL |
54.4% |
46.1% |
27.2% |
19.3% |
|
|
||||
|
Philadelphia-Camden-Wilmington, PA-NJ-DE-MD |
50.8% |
37.5% |
27.2% |
13.8% |
|
|
||||
|
Phoenix-Mesa-Scottsdale, AZ |
50.2% |
41.9% |
23.6% |
16.7% |
|
|
||||
|
Pittsburgh, PA |
46.2% |
28.9% |
24.0% |
9.9% |
|
|
||||
|
Portland-South Portland-Biddeford, ME |
54.7% |
40.1% |
27.4% |
13.9% |
|
|
||||
|
Portland-Vancouver-Beaverton, OR-WA |
47.7% |
41.3% |
23.1% |
14.6% |
|
|
||||
|
Poughkeepsie-Newburgh-Middletown, NY |
52.8% |
46.0% |
27.3% |
17.2% |
|
|
||||
|
Providence-New Bedford-Fall River, RI-MA |
48.2% |
43.0% |
24.4% |
16.7% |
|
|
||||
|
Provo-Orem, UT |
46.2% |
36.8% |
19.8% |
12.6% |
|
|
||||
|
Raleigh-Cary, NC |
46.3% |
27.2% |
20.8% |
8.7% |
|
|
||||
|
Richmond, VA |
49.6% |
32.1% |
23.4% |
9.8% |
|
|
||||
|
Riverside-San Bernardino-Ontario, CA |
59.8% |
56.2% |
32.0% |
26.1% |
|
|
||||
|
Rochester, NY |
52.0% |
30.0% |
29.7% |
9.9% |
|
|
||||
|
Sacramento–Arden-Arcade–Roseville, CA |
52.0% |
50.3% |
24.7% |
19.7% |
|
|
||||
|
St. Louis, MO-IL |
47.3% |
29.8% |
24.0% |
10.5% |
|
|
||||
|
Salt Lake City, UT |
42.9% |
34.0% |
19.5% |
12.0% |
|
|
||||
|
San Antonio, TX |
50.6% |
31.5% |
25.4% |
11.6% |
|
|
||||
|
San Diego-Carlsbad-San Marcos, CA |
55.4% |
54.4% |
28.3% |
25.2% |
|
|
||||
|
San Francisco-Oakland-Fremont, CA |
49.5% |
53.0% |
25.1% |
23.4% |
|
|
||||
|
San Jose-Sunnyvale-Santa Clara, CA |
44.0% |
51.4% |
20.7% |
21.3% |
|
|
||||
|
Scranton–Wilkes-Barre, PA |
42.8% |
31.7% |
20.7% |
11.5% |
|
|
||||
|
Seattle-Tacoma-Bellevue, WA |
48.1% |
43.9% |
22.6% |
15.2% |
|
|
||||
|
Springfield, MA |
53.8% |
38.1% |
27.9% |
13.4% |
|
|
||||
|
Stockton, CA |
57.3% |
55.0% |
31.3% |
24.4% |
|
|
||||
|
Syracuse, NY |
52.3% |
26.8% |
27.2% |
8.7% |
|
|
||||
|
Tampa-St. Petersburg-Clearwater, FL |
54.8% |
46.7% |
27.0% |
19.0% |
|
|
||||
|
Toledo, OH |
51.3% |
33.6% |
28.6% |
11.7% |
|
|
||||
|
Tucson, AZ |
52.2% |
39.2% |
27.4% |
14.7% |
|
|
||||
|
Tulsa, OK |
45.5% |
27.1% |
21.3% |
9.9% |
|
|
||||
|
Virginia Beach-Norfolk-Newport News, VA-NC |
50.8% |
39.0% |
23.7% |
12.1% |
|
|
||||
|
Washington-Arlington-Alexandria, DC-VA-MD-WV |
46.9% |
39.8% |
21.5% |
14.7% |
|
|
||||
|
Wichita, KS |
47.7% |
22.9% |
22.7% |
7.1% |
|
|
||||
|
Worcester, MA |
44.5% |
36.8% |
18.7% |
12.5% |
|
|
||||
|
Youngstown-Warren-Boardman, OH-PA |
49.1% |
33.0% |
26.1% |
13.3% |
|
|
||||
|
|
|
|
|
|
|
|
||||
|
U.S. |
49.8% |
37.7% |
25.1% |
14.7% |
|
|
||||
|
|
|
|
|
|
|
|
||||
|
Note: Housing costs include rent or mortgage payment, taxes, insurance, utilities |
||||