
Other

The sun smiled on Fraser Valley home sellers in July, after a year of diminishing sales at 10-year-low levels. There were more real estate sales on the MLS® than the previous July, but more surprisingly, there were 10 per cent more sales than in June. That is anything but typical market behaviour, as Fraser Valley Real Estate Board president-elect Ray Werger points out.
“Buoyancy during the summer is rare at the best of times and yet I’ve just experienced the busiest July in my 20 plus years as a REALTOR®. To jump from the worst June in 10 years to a slightly below average July may not sound unusual or unexpected, but it was.”
Year-over-year comparisons are also remarkable. Realtors in other parts of the country are scratching their heads at double-digit increases. Toronto home sales were up 10 per cent over July 2012, Calgary saw 17 per cent more sales, Edmonton had 25 per cent more and Greater Vancouver sales jumped by an amazing 40.4 per cent.
The Fraser Valley’s year-over-year property* sales increase of 5 per cent may be modest in comparison, but it’s still encouraging. A year after Ottawa tightened borrowing rules and made it harder for first-time buyers to get into the market, “slightly below average” doesn’t look so bad.
Sales and Listings
In the Fraser Valley last month, 774 detached houses changed hands, along with 280 townhouses and 239 condominiums – in all cases, higher sales than June. Sellers must have sensed this renewed energy in the market, because new listings rose as well. New listings of detached houses went up by 6.2 per cent to 1,209. Townhouse listings rose by 3.5 per cent to 451, and 443 condos hit the market, a rise of 13.1 per cent.
However, active listings remained about the same because of the increased sales. The sales-to-active-listings ratio indicates the rate at which properties are selling. For residential properties it’s at a healthy 16.8 per cent, with detached houses at 18 per cent. This is considered a sign of a balanced market.
|
What’s Up, What’s Down – At a Glance |
||
|
|
July/ June 2013 |
July 2013/ July 2012 |
|
Overall Home Sales |
+8.4% |
+3.0% |
|
– Detached |
+7.8% |
+6.8% |
|
– Townhouse |
+5.3% |
-2.1% |
|
– Apartment |
+14.9% |
-2.0% |
|
New Listings |
+6.2% |
-5.9% |
|
Active Listings |
-2.0% |
-5.5% |
See detailed Fraser Valley Real Estate Board statistics, broken down by community.
MLS® Benchmark Prices
With supply and demand in balance, prices aren’t moving much.
|
Fraser Valley MLS® Benchmark Prices, % Change |
|||
|
|
July 2013 |
June 2013 |
July 2012 |
|
Detached |
$551,000 |
-0.2% |
-0.1% |
|
Townhouse |
$297,800 |
-0.3% |
-1.8% |
|
Apartment |
$202,000 |
-0.2% |
-2.0% |
Benchmark prices are based on the price of a typical home for its neighbourhood. The MLS benchmark price was designed to be less volatile than average prices. It ignores sales of extremely high-priced or low-priced properties and concentrates instead on what the majority of buyers are looking for in a given area. Thus, benchmark prices and average prices can be wildly different. For example, in South Surrey White Rock, July’s benchmark price for a detached house was $849,500 while the average price was $1,033,291.
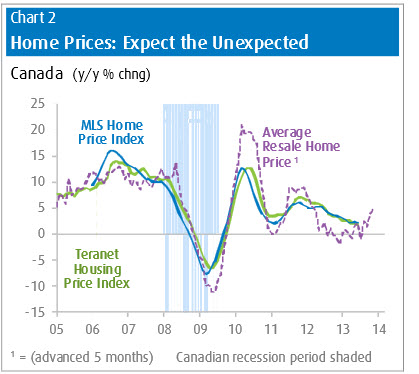
However, in a new “Talking Points” report from BMO Capital Markets, Chief Economist Douglas Porter observed that benchmark prices don’t give us much of an idea of where the market is going. For that, he looks to average prices, which he says lead benchmark prices by three to five months.
This chart shows Canadian benchmark prices from both the MLS and Teranet National. The dotted line is average prices from five months ago. They’ve been advanced for easy comparison. They’re more extreme, but look how closely they match the trend.
It appears that the movement of average prices can predict the price trend of the residential market.
With that in mind, let’s take a look at the future. Here’s a chart of the average price for all property types combined. The yellow line is three to five months ago. Looks like the stability in price will continue.
Ray Werger sums it up: “Year over year, prices are stable or down slightly, however the six-month trend is showing one to two per cent increases for all property types; again underlying the return to an average or typical housing market.”
* FVREB’s overall sales numbers include all types of property including commercial, agricultural and industrial. The statistics given in the tables above are strictly residential.
© 2013 Real Estate Weekly