
Julie Schmit
USA Today
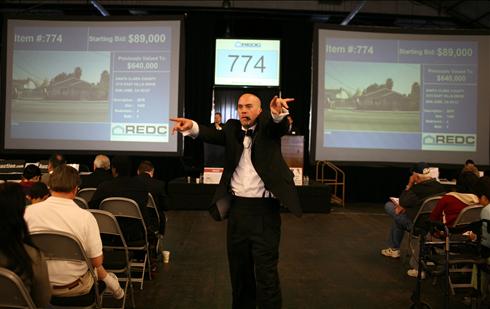
A bidder assistant points out bids at a foreclosed home auction in April in San Mateo, Calif. By Justin Sullivan, Getty Images
Sales of existing homes picked up in 17 states in the first quarter compared with the previous one, pointing to more signs of life for the home market.
Nationally, first-quarter sales of existing homes were down 3.2% from the last three months of 2008 and down 6.8% year-over-year, the National Association of Realtors said Tuesday.
But the improvement in 17 states is more evidence that the market is bottoming out, economists say. In the fourth quarter, only nine states showed better sales. Economists predict more states will show sales gains throughout the year, given still-falling prices in many markets, low mortgage rates and some signs of improvement in the overall economy.
“There are early signs of recovery in some states. They give me reason for optimism,” says Patrick Newport, economist at IHS Global Insight. He expects home sales to pick up nationwide in the later part of this year.
The pace of the pickup this year may “surprise to the upside,” says Greg McBride, senior financial analyst at Bankrate.com. That’s because prices have dropped so much that more people can afford homes, he says.
That trend continued in the first quarter. Single-family home prices declined year-over-year in 134 of 152 metropolitan areas, NAR says. Nationwide, the median sales price for a single-family home was $169,000, down 13.8% from the same quarter a year ago. Median means half sold for more and half sold for less.
Median prices are skewed downward by the number of foreclosed and distressed homes being sold. They’re selling for 20% less than traditional homes and account for about half of all sales, NAR says.
That’s attracting many first-time buyers, who accounted for about half of the quarter’s sales, NAR says.
Low prices — driven by sales of foreclosed and distressed homes — helped Minnesota post a 12% gain in the first quarter compared with the same period a year ago, NAR says. Median prices there are at 1997 levels, says Christopher Galler, chief operating officer of the Minnesota Association of Realtors. He says foreclosures and short sales — in which banks forgive some of what is owed — account for 50% of transactions.
That’s also true nationwide, NAR says. The glut of distressed homes on the market will continue to be a “drag on prices,” McBride says.
The states with the largest sales gains from the fourth quarter were: Wyoming, 44%; Alaska, 37%; Nevada, 25%; and Minnesota, 22%. The figures include single-family homes, condos and co-ops.
|
Median sale price of existing single-family homes in these metropolitan areas (in thousands) |
|
|||||
|
|
2006 |
2007 |
2008Q1 |
2008Q4 |
2009Q1 |
Change from Q1 2008 |
|
|
||||||
|
Akron, OH |
$114.6 |
$119.3 |
$96.3 |
$86.1 |
$50.1 |
-48.0% |
|
|
||||||
|
Albany-Schenectady-Troy, NY |
$195.4 |
$198.9 |
$194.1 |
$193.1 |
$184.5 |
-4.9% |
|
|
||||||
|
Albuquerque, NM |
$184.2 |
$198.5 |
$190.5 |
$183.7 |
$182.6 |
-4.1% |
|
|
||||||
|
Allentown-Bethlehem-Easton, PA-NJ |
$248.1 |
$260.8 |
$237.0 |
$238.0 |
$218.0 |
-8.0% |
|
|
||||||
|
Amarillo, TX |
$114.9 |
$118.4 |
$122.2 |
$122.6 |
$122.0 |
-0.2% |
|
|
||||||
|
Anaheim-Santa Ana, CA (OrangeCo.) |
$709.0 |
$709.5 |
$607.4 |
$464.8 |
$435.8 |
-28.3% |
|
|
||||||
|
Appleton, WI |
$129.2 |
$130.0 |
$120.4 |
$127.6 |
$110.3 |
-8.4% |
|
|
||||||
|
Atlanta-Sandy Springs-Marietta, GA |
$171.8 |
$172.0 |
$154.0 |
$129.2 |
$115.6 |
-24.9% |
|
|
||||||
|
AtlanticCity, NJ |
$254.8 |
$269.7 |
$277.4 |
$229.1 |
$219.1 |
-21.0% |
|
|
||||||
|
Austin-Round Rock, TX |
$173.7 |
$183.7 |
$184.5 |
$184.8 |
$182.3 |
-1.2% |
|
|
||||||
|
Baltimore-Towson, MD |
$279.9 |
$286.1 |
$270.5 |
$260.1 |
$245.8 |
-9.1% |
|
|
||||||
|
BarnstableTown, MA |
$389.5 |
$384.7 |
$355.2 |
$325.5 |
$276.7 |
-22.1% |
|
|
||||||
|
Baton Rouge, LA |
$169.5 |
$174.4 |
$169.2 |
$156.4 |
N/A |
N/A |
|
|
||||||
|
Beaumont-Port Arthur, TX |
$112.7 |
$123.0 |
$122.9 |
$132.6 |
$129.1 |
5 .0% |
|
|
||||||
|
Binghamton, NY |
$96.9 |
$111.2 |
$109.7 |
$105.8 |
$110.3 |
0 .5% |
|
|
||||||
|
Birmingham-Hoover, AL |
$165.1 |
$161.3 |
$153.2 |
$135.4 |
$130.4 |
-14.9% |
|
|
||||||
|
Bismarck, ND |
$134.9 |
$152.9 |
$153.4 |
$164.5 |
$153.3 |
-0.1% |
|
|
||||||
|
Bloomington-Normal, IL |
$152.2 |
$154.0 |
$150.9 |
$159.3 |
$153.8 |
1 .9% |
|
|
||||||
|
Boise City-Nampa, ID |
N/A |
$206.0 |
$193.4 |
$168.8 |
$157.1 |
-18.8% |
|
|
||||||
|
Boston-Cambridge-Quincy, MA-NH |
$402.2 |
$395.6 |
$357.7 |
$336.0 |
$290.7 |
-18.7% |
|
|
||||||
|
Boulder, CO |
$366.4 |
$376.2 |
$355.7 |
$324.7 |
$328.4 |
-7.7% |
|
|
||||||
|
Bridgeport-Stamford-Norwalk, CT |
$473.7 |
$486.6 |
$439.3 |
$380.6 |
$347.4 |
-20.9% |
|
|
||||||
|
Buffalo-NiagaraFalls, NY |
$97.9 |
$104.0 |
$96.6 |
$106.2 |
$99.2 |
2 .7% |
|
|
||||||
|
Canton-Massillon, OH |
$109.3 |
$110.3 |
$88.5 |
$80.4 |
$66.2 |
-25.2% |
|
|
||||||
|
Cape Coral-Fort Myers, FL |
$268.2 |
$252.1 |
$213.2 |
$110.9 |
$87.3 |
-59.1% |
|
|
||||||
|
Cedar Rapids, IA |
$133.8 |
$136.2 |
$129.9 |
$136.9 |
$127.3 |
-2.0% |
|
|
||||||
|
Champaign-Urbana, IL |
$143.0 |
$144.1 |
$139.4 |
$132.0 |
$141.6 |
1 .6% |
|
|
||||||
|
Charleston-North Charleston, SC |
$212.4 |
$215.4 |
$201.4 |
$193.8 |
$188.2 |
-6.6% |
|
|
||||||
|
Charleston, WV |
$119.4 |
$122.5 |
$116.8 |
$124.7 |
$119.2 |
2 .1% |
|
|
||||||
|
Charlotte-Gastonia-Concord, NC-SC |
$190.6 |
$204.3 |
$192.7 |
$186.3 |
$171.5 |
-11.0% |
|
|
||||||
|
Chattanooga, TN-GA |
$136.0 |
$130.9 |
$125.2 |
$123.8 |
$117.9 |
-5.8% |
|
|
||||||
|
Chicago-Naperville-Joliet, IL |
$273.5 |
$276.6 |
$249.6 |
$217.8 |
$185.6 |
-25.6% |
|
|
||||||
|
Cincinnati-Middletown, OH-KY-IN |
$143.2 |
$140.8 |
$128.5 |
$116.0 |
$106.5 |
-17.1% |
|
|
||||||
|
Cleveland-Elyria-Mentor, OH |
$134.4 |
$130.0 |
$102.1 |
$88.3 |
$69.9 |
-31.5% |
|
|
||||||
|
ColordoSprings, CO |
$218.2 |
$217.5 |
$208.9 |
$187.0 |
$180.0 |
-13.8% |
|
|
||||||
|
Columbia, MO |
$139.3 |
$147.1 |
$143.9 |
$138.1 |
$152.6 |
6 .0% |
|
|
||||||
|
Columbia, SC |
$141.6 |
$146.6 |
$141.6 |
$139.2 |
$134.3 |
-5.2% |
|
|
||||||
|
Columbus, OH |
$148.1 |
$147.4 |
$132.0 |
$126.5 |
$118.3 |
-10.4% |
|
|
||||||
|
CorpusChristi, TX |
$131.8 |
$136.5 |
$136.8 |
$134.0 |
$126.3 |
-7.7% |
|
|
||||||
|
Cumberland, MD-WV |
$95.7 |
$109.4 |
$94.9 |
$96.9 |
$114.9 |
2 1.1% |
|
|
||||||
|
Dallas-Fort Worth-Arlington, TX |
$149.5 |
$150.9 |
$142.4 |
$138.0 |
$135.7 |
-4.7% |
|
|
||||||
|
Danville, IL |
N/A |
N/A |
N/A |
N/A |
N/A |
N/A |
|
|
||||||
|
Davenport-Moline-Rock Island, IA-IL |
$119.7 |
$108.7 |
$88.1 |
$98.1 |
$100.3 |
1 3.8% |
|
|
||||||
|
Dayton, OH |
$116.7 |
$115.6 |
$100.5 |
$87.8 |
$79.7 |
-20.7% |
|
|
||||||
|
Decatur, IL |
$85.4 |
$83.1 |
$79.4 |
$79.3 |
$77.1 |
-2.9% |
|
|
||||||
|
Deltona-Daytona Beach-Ormond Beach, FL |
$205.8 |
$192.3 |
$175.6 |
$143.6 |
$128.7 |
-26.7% |
|
|
||||||
|
Denver-Aurora, CO |
$249.5 |
$245.4 |
$223.5 |
$200.8 |
$192.9 |
-13.7% |
|
|
||||||
|
Des Moines, IA |
$145.1 |
$149.2 |
$147.9 |
$149.7 |
$137.3 |
-7.2% |
|
|
||||||
|
Detroit-Warren-Livonia, MI |
$151.7 |
$140.3 |
N/A |
N/A |
N/A |
N/A |
|
|
||||||
|
Dover, DE |
$208.0 |
$207.5 |
$199.1 |
$212.4 |
$201.0 |
1 .0% |
|
|
||||||
|
Durham, NC |
$172.8 |
$178.4 |
$178.2 |
$165.6 |
$171.5 |
-3.8% |
|
|
||||||
|
Elmira, NY |
$86.8 |
$81.6 |
$82.4 |
$80.9 |
$77.1 |
-6.4% |
|
|
||||||
|
ElPaso, TX |
$127.6 |
$131.9 |
$133.9 |
$140.7 |
$132.8 |
-0.8% |
|
|
||||||
|
Erie, PA |
$101.3 |
$98.1 |
$96.6 |
$95.2 |
$85.9 |
-11.1% |
|
|
||||||
|
Eugene-Springfield, OR |
$230.6 |
$239.6 |
$227.5 |
$212.8 |
$210.8 |
-7.3% |
|
|
||||||
|
Fargo, ND-MN |
$136.5 |
$140.9 |
$136.9 |
$140.1 |
$134.1 |
-2.0% |
|
|
||||||
|
Farmington, NM |
$172.3 |
$191.1 |
$189.9 |
$184.9 |
$191.2 |
0 .7% |
|
|
||||||
|
Florence, SC |
$119.5 |
$124.2 |
$116.9 |
$119.1 |
$98.5 |
-15.7% |
|
|
||||||
|
Ft. Wayne, IN |
$99.7 |
$97.1 |
$88.7 |
$88.6 |
$80.6 |
-9.1% |
|
|
||||||
|
Gainesville, FL |
$213.2 |
$211.1 |
$188.3 |
$174.0 |
$160.3 |
-14.9% |
|
|
||||||
|
Gary-Hammond, IN |
$128.1 |
$134.2 |
$124.0 |
$115.1 |
$92.0 |
-25.8% |
|
|
||||||
|
GlensFalls, NY |
$161.6 |
$167.6 |
$163.1 |
$147.6 |
$156.6 |
-4.0% |
|
|
||||||
|
GrandRapids, MI |
$134.5 |
$129.4 |
$102.8 |
$80.5 |
$72.0 |
-30.0% |
|
|
||||||
|
GreenBay, WI |
$151.3 |
$150.7 |
$137.0 |
$146.6 |
$138.4 |
1 .0% |
|
|
||||||
|
Greensboro-HighPoint, NC |
$149.4 |
$152.0 |
$142.3 |
$135.4 |
$129.7 |
-8.9% |
|
|
||||||
|
Greenville, SC |
$152.0 |
$153.6 |
$154.5 |
$146.9 |
$142.0 |
-8.1% |
|
|
||||||
|
Gulfport-Biloxi, MS |
$145.8 |
$154.5 |
$139.0 |
$129.5 |
$132.8 |
-4.5% |
|
|
||||||
|
Hagerstown-Martinsburg, MD-WV |
$223.1 |
$208.5 |
$192.7 |
$171.4 |
$167.1 |
-13.3% |
|
|
||||||
|
Hartford-West Hartford-East Hartford, CT |
$258.1 |
$263.2 |
$247.3 |
$233.7 |
$222.3 |
-10.1% |
|
|
||||||
|
Honolulu, HI |
$630.0 |
$643.5 |
$620.0 |
$610.0 |
$570.0 |
-8.1% |
|
|
||||||
|
Houston-Baytown-SugarLand, TX |
$149.1 |
$152.5 |
$148.4 |
$142.1 |
$138.5 |
-6.7% |
|
|
||||||
|
Indianapolis, IN |
$119.3 |
$120.5 |
$107.3 |
$100.2 |
$94.6 |
-11.8% |
|
|
||||||
|
Jackson, MS |
$147.1 |
$139.0 |
$123.6 |
$126.6 |
$122.6 |
-0.8% |
|
|
||||||
|
Jacksonville, FL |
$193.0 |
$189.2 |
$185.7 |
$160.7 |
$154.1 |
-17.0% |
|
|
||||||
|
Kalamazoo-Portage, MI |
N/A |
N/A |
N/A |
N/A |
N/A |
N/ A |
|
|
||||||
|
Kankakee-Bradley, IL |
$131.5 |
$134.5 |
$119.3 |
$125.6 |
$116.6 |
-2.3% |
|
|
||||||
|
KansasCity, MO-KS |
$155.8 |
$153.3 |
$139.5 |
$131.0 |
$126.6 |
-9.2% |
|
|
||||||
|
Kennewick-Richland-Pasco, WA |
$156.1 |
$169.2 |
$163.7 |
$165.9 |
$159.3 |
-2.7% |
|
|
||||||
|
Kingston, NY |
$252.7 |
$258.4 |
$237.8 |
$224.0 |
$194.3 |
-18.3% |
|
|
||||||
|
Knoxville, TN |
$151.2 |
$156.4 |
$146.0 |
$141.7 |
$138.6 |
-5.1% |
|
|
||||||
|
Lansing-E.Lansing, MI |
$137.7 |
$126.8 |
$92.5 |
$80.0 |
$65.6 |
-29.1% |
|
|
||||||
|
LasVegas-Paradise, NV |
$317.4 |
$297.7 |
$247.6 |
$181.7 |
$155.3 |
-37.3% |
|
|
||||||
|
Lexington-Fayette, KY |
$147.8 |
$147.5 |
$138.9 |
$138.2 |
$133.8 |
-3.7% |
|
|
||||||
|
Lincoln, NE |
$137.5 |
$137.5 |
$134.0 |
$133.1 |
$132.4 |
-1.2% |
|
|
||||||
|
Little Rock-N.LittleRock, AR |
$127.0 |
$129.1 |
$127.2 |
$125.2 |
$125.4 |
-1.4% |
|
|
||||||
|
Los Angeles-Long Beach-Santa Ana, CA |
$584.8 |
$593.6 |
$460.5 |
$354.3 |
$303.5 |
-34.1% |
|
|
||||||
|
Louisville, KY-IN |
$137.6 |
$137.4 |
$131.6 |
$124.0 |
$121.1 |
-8.0% |
|
|
||||||
|
Madison, WI |
$223.2 |
$226.5 |
$217.1 |
$227.0 |
$208.5 |
-4.0% |
|
|
||||||
|
Manchester-Nashua, NH |
N/A |
N/A |
$245.1 |
$238.6 |
$215.7 |
-12.0% |
|
|
||||||
|
Memphis, TN-MS-AR |
$142.3 |
$137.2 |
$110.8 |
$100.2 |
$96.1 |
-13.3% |
|
|
||||||
|
Miami-Fort Lauderdale-Miami Beach, FL |
$371.2 |
$365.5 |
$319.1 |
$234.2 |
$206.0 |
-35.4% |
|
|
||||||
|
Milwaukee-Waukesha-West Allis, WI |
$220.9 |
$223.4 |
$204.4 |
$194.9 |
$201.5 |
-1.4% |
|
|
||||||
|
Minneapolis-St.Paul-Bloomington, MN-WI |
$232.3 |
$225.2 |
$199.9 |
$188.6 |
$174.1 |
-12.9% |
|
|
||||||
|
Mobile, AL |
$137.0 |
$136.4 |
$129.9 |
$125.0 |
$127.9 |
-1.5% |
|
|
||||||
|
Montgomery, AL |
$144.2 |
$143.8 |
$133.7 |
$126.3 |
$122.5 |
-8.4% |
|
|
||||||
|
Nashville-Davidson–Murfreesboro, TN |
N/A |
N/A |
N/A |
N/A |
N/A |
N/ A |
|
|
||||||
|
New Haven-Milford, CT |
$287.7 |
$286.5 |
$255.5 |
$240.4 |
$216.5 |
-15.3% |
|
|
||||||
|
New Orleans-Metairie-Kenner, LA |
$173.1 |
$160.3 |
$157.1 |
$154.9 |
$150.8 |
-4.0% |
|
|
||||||
|
New York-N. NJ-Long Island, NY-NJ-PA |
$469.3 |
$469.7 |
$445.8 |
$391.4 |
$374.5 |
-16.0% |
|
|
||||||
|
New York-Wayne-White Plains, NY-NJ |
$539.4 |
$540.3 |
$492.8 |
$459.2 |
$429.9 |
-12.8% |
|
|
||||||
|
NY:Edison, NJ |
$387.7 |
$380.3 |
$361.8 |
$344.0 |
$320.9 |
-11.3% |
|
|
||||||
|
NY:Nassau-Suffolk, NY |
$474.7 |
$477.2 |
$462.8 |
$382.1 |
$376.7 |
-18.6% |
|
|
||||||
|
NY:Newark-Union, NJ-PA |
$433.0 |
$443.7 |
$409.4 |
$374.4 |
$358.2 |
-12.5% |
|
|
||||||
|
Norwich-New London, CT |
$264.0 |
$267.7 |
$244.9 |
$223.1 |
$199.6 |
-18.5% |
|
|
||||||
|
Ocala, FL |
$165.8 |
$164.6 |
$145.5 |
$121.7 |
$108.6 |
-25.4% |
|
|
||||||
|
Oklahoma City, OK |
$125.0 |
$134.9 |
$124.9 |
$124.2 |
$129.9 |
4 .0% |
|
|
||||||
|
Omaha, NE-IA |
$138.4 |
$138.0 |
$132.9 |
$129.7 |
$129.0 |
-2.9% |
|
|
||||||
|
Orlando, FL |
$270.4 |
$261.3 |
$232.0 |
$175.2 |
$154.8 |
-33.3% |
|
|
||||||
|
Palm Bay-Melbourne-Titusville, FL |
$212.0 |
$183.6 |
$158.8 |
$123.6 |
$114.3 |
-28.0% |
|
|
||||||
|
Pensacola-FerryPass-Brent, FL |
$166.0 |
$165.6 |
$156.3 |
$151.7 |
$137.2 |
-12.2% |
|
|
||||||
|
Peoria, IL |
$112.7 |
$118.6 |
$119.0 |
$117.2 |
$109.8 |
-7.7% |
|
|
||||||
|
Philadelphia-Camden-Wilmington, PA-NJ-DE-MD |
$230.2 |
$234.9 |
$220.9 |
$212.5 |
$206.0 |
-6.7% |
|
|
||||||
|
Phoenix-Mesa-Scottsdale, AZ |
$268.2 |
$257.4 |
$222.2 |
$155.9 |
$129.2 |
-41.9% |
|
|
||||||
|
Pittsburgh, PA |
$116.1 |
$120.7 |
$111.6 |
$109.1 |
$103.4 |
-7.3% |
|
|
||||||
|
Pittsfield, MA |
$212.9 |
$217.4 |
$216.6 |
$206.0 |
$180.0 |
-16.9% |
|
|
||||||
|
Portland-South Portland-Biddeford, ME |
$243.8 |
$242.7 |
$234.0 |
$214.5 |
$192.1 |
-17.9% |
|
|
||||||
|
Portland-Vancouver-Beaverton, OR-WA |
$280.8 |
$295.2 |
$286.6 |
$264.5 |
$248.6 |
-13.3% |
|
|
||||||
|
Providence-New Bedford-Fall River, RI-MA |
$289.6 |
$286.5 |
$262.9 |
$224.5 |
$202.4 |
-23.0% |
|
|
||||||
|
Raleigh-Cary, NC |
$213.8 |
$224.2 |
$228.1 |
$230.9 |
$223.0 |
-2.2% |
|
|
||||||
|
Reading, PA |
$143.2 |
$154.7 |
$148.4 |
$155.1 |
$145.2 |
-2.2% |
|
|
||||||
|
Reno-Sparks, NV |
$347.2 |
$321.4 |
$283.7 |
$231.2 |
$209.8 |
-26.0% |
|
|
||||||
|
Richmond, VA |
$225.5 |
$233.7 |
$219.1 |
$199.4 |
N/A |
N/ A |
|
|
||||||
|
Riverside-San Bernardino-Ontario, CA |
$400.7 |
$379.5 |
$287.1 |
$201.3 |
$172.5 |
-39.9% |
|
|
||||||
|
Rochester, NY |
$114.8 |
$117.9 |
$108.5 |
$112.5 |
$105.6 |
-2.7% |
|
|
||||||
|
Rockford, IL |
$119.3 |
$119.3 |
$115.2 |
$111.5 |
$100.0 |
-13.2% |
|
|
||||||
|
Sacramento–Arden-Arcade–Roseville, CA |
$374.5 |
$342.8 |
$258.5 |
$187.9 |
$169.3 |
-34.5% |
|
|
||||||
|
Saginaw-Saginaw Township North, MI |
N/A |
$82.1 |
$65.4 |
$43.9 |
$30.3 |
-53.7% |
|
|
||||||
|
Saint Louis, MO-IL |
$148.4 |
$145.4 |
$121.4 |
$113.7 |
$100.9 |
-16.9% |
|
|
||||||
|
Salem, OR |
$212.9 |
$228.3 |
$218.5 |
$198.0 |
$200.0 |
-8.5% |
|
|
||||||
|
SaltLakeCity, UT |
$203.0 |
$232.0 |
$225.7 |
$225.4 |
$230.1 |
1 .9% |
|
|
||||||
|
SanAntonio, TX |
$141.7 |
$153.2 |
$149.8 |
$143.4 |
$148.3 |
-1.0% |
|
|
||||||
|
San Diego-Carlsbad-San Marcos, CA |
$601.8 |
$588.7 |
$459.0 |
$332.8 |
$323.2 |
-29.6% |
|
|
||||||
|
San Francisco-Oakland-Fremont, CA |
$752.8 |
$804.8 |
$701.7 |
$487.1 |
$402.0 |
-42.7% |
|
|
||||||
|
San Jose-Sunnyvale-Santa Clara, CA |
$775.0 |
$836.8 |
$780.0 |
$525.0 |
$450.0 |
-42.3% |
|
|
||||||
|
Sarasota-Bradenton-Venice, FL |
$334.3 |
$310.9 |
$262.3 |
$178.1 |
$155.2 |
-40.8% |
|
|
||||||
|
Seattle-Tacoma-Bellevue, WA |
$361.2 |
$386.9 |
$372.3 |
$325.9 |
$315.2 |
-15.3% |
|
|
||||||
|
Shreveport-BossierCity, LA |
$132.2 |
$135.6 |
$131.5 |
$139.2 |
$136.0 |
3 .4% |
|
|
||||||
|
SiouxFalls, SD |
$138.0 |
$144.5 |
$136.0 |
$142.4 |
$95.5 |
-29.8% |
|
|
||||||
|
SouthBend-Mishawaka, IN |
$92.7 |
$90.7 |
$80.9 |
$80.8 |
$61.8 |
-23.6% |
|
|
||||||
|
Spartanburg, SC |
$126.7 |
$128.6 |
$130.3 |
$120.8 |
$109.1 |
-16.3% |
|
|
||||||
|
Spokane, WA |
$184.1 |
$193.8 |
$185.0 |
$185.9 |
$180.0 |
-2.7% |
|
|
||||||
|
Springfield, IL |
$105.4 |
$109.0 |
$107.2 |
$96.7 |
$111.4 |
3 .9% |
|
|
||||||
|
Springfield, MA |
$209.6 |
$211.9 |
$198.1 |
$186.4 |
$170.1 |
-14.1% |
|
|
||||||
|
Springfield, MO |
$124.8 |
$122.6 |
$120.9 |
$117.1 |
$116.3 |
-3.8% |
|
|
||||||
|
Syracuse, NY |
$116.8 |
$121.8 |
$110.3 |
$114.1 |
$113.7 |
3 .1% |
|
|
||||||
|
Tallahassee, FL |
$177.5 |
$179.5 |
$173.3 |
$150.1 |
$156.0 |
-10.0% |
|
|
||||||
|
Tampa-St.Petersburg-Clearwater, FL |
$228.9 |
$214.9 |
$184.7 |
$151.5 |
$135.3 |
-26.7% |
|
|
||||||
|
Toledo, OH |
$110.0 |
$106.6 |
$89.7 |
$75.6 |
$65.5 |
-27.0% |
|
|
||||||
|
Topeka, KS |
$106.1 |
$111.9 |
$103.3 |
$104.8 |
$106.5 |
3 .1% |
|
|
||||||
|
Trenton-Ewing, NJ |
$289.6 |
$307.1 |
$288.2 |
$247.8 |
$252.5 |
-12.4% |
|
|
||||||
|
Tucson, AZ |
$244.9 |
$244.8 |
$221.0 |
$185.9 |
$176.4 |
-20.2% |
|
|
||||||
|
Tulsa, OK |
N/A |
N/A |
$122.2 |
N/A |
N/A |
N/A |
|
|
||||||
|
Virginia Beach-Norfolk-Newport News, VA-NC |
$216.0 |
$226.8 |
$219.0 |
$210.0 |
$201.0 |
-8.2% |
|
|
||||||
|
Washington-Arl.-Alexandria, DC-VA-MD-WV |
$431.0 |
$430.8 |
$372.5 |
$295.1 |
$279.4 |
-25.0% |
|
|
||||||
|
Waterloo/Cedar Falls, IA |
$108.9 |
$112.8 |
$104.0 |
$105.2 |
$97.3 |
-6.4% |
|
|
||||||
|
Wichita, KS |
$114.9 |
$115.6 |
$112.7 |
$118.2 |
$108.7 |
-3.5% |
|
|
||||||
|
Worcester, MA |
$281.7 |
$274.6 |
$248.2 |
$217.0 |
$189.6 |
-23.6% |
|
|
||||||
|
Yakima, WA |
$136.5 |
$156.5 |
$148.4 |
$145.9 |
$143.5 |
-3.3% |
|
|
||||||
|
Youngstown-Warren-Boardman, OH-PA |
$81.5 |
$78.9 |
$67.7 |
$61.7 |
$51.2 |
-24.4% |
|
N/A-not available |
||||||